OFFSHORE WIND WOULD’VE YAWNED AT SUPERSTORM SANDY
Dr. Christopher G. Hart, Founder of OPTIMUM Offshore Wind Energy Systems, LLC
Mr. Walt Musial, Manager of Offshore Wind and Ocean Power Systems at the National Renewable Energy Laboratory (NREL)Although hurricane Sandy (Oct. 2012) was arguably the worst storm to hit the northeastern Atlantic in recent memory, Sandy’s winds were relatively low compared to the worst case scenario and would have had a minimal impact on offshore wind farms installed in her path. This posting is the first in a series from the US Offshore Wind Collaborative on the topic of Extreme Weather Impacts on Offshore Wind Turbines, and provides data and analysis that supports the above statement.
Sandy at sea; by the numbers
It is estimated that damages to private property and public infrastructure from Hurricane Sandy could reach $50 billion; however, it has been extensively chronicled that the storm had a minimal impact on the 3,500 MW of onshore wind that it touched, including six turbines that were almost directly in the path of the eye as it made landfall. Although offshore turbines sited in the water would also have the added exposure to extreme waves and wind simultaneously, we believe the current offshore wind turbine designs have capacity to have weathered this storm unharmed.
To allow us to assess the conditions offshore, the National Oceanographic and Atmospheric Administration (NOAA) maintains a fleet of buoys that collect wind and wave data at various locations around the United States. This data can be accessed on-line from the National Data Buoy Center (NDBC) homepage. For our purposes, two buoys in particular moored near the path of Sandy were helpful. Data from NDBC Buoy 44025, located 30 miles south of Islip, NY, and NDBC Buoy 44009 located 25 miles southeast of Cape May, NJ were examined for the period from the October 28-30 – the duration of Sandy.
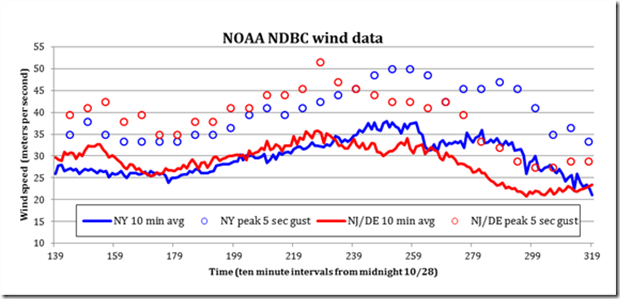
Figure 1: National Oceanographic and Atmospheric Administration, National Data Buoy Center (NOAA NDBC) wind speed data for the time period of interest, extrapolated to 90 m hub height for buoys near the path of hurricane Sandy
The raw wind data downloaded from the NDBC are generated by buoy mounted anemometers at a height above the sea surface of 5 meters. The data in the figure above is extrapolated to a hub height of 90 meters using the power law with a IEC default, and most-probably conservative, shear coefficient of 0.143. It should be noted that the maximum wind in this data set was a 5 second gust of 52 m/s or 116 mph and that the 10 minute average wind speeds did not exceed 38 m/s or 85 mph.
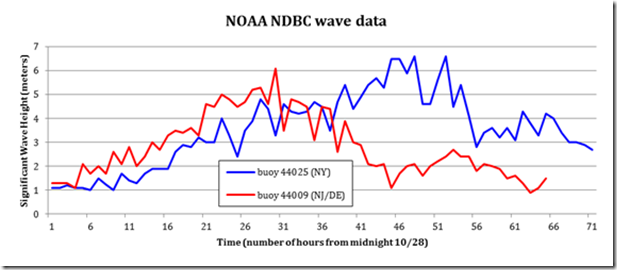
In addition to wind, offshore wind systems are affected by waves. The graphic below represents data taken from the same NDBC buoys, but this time highlighting the significant wave height. Significant wave height is a statistical representation of a sea state that estimates the average of the highest 1/3 of the waves during a given time period. Again, it should be noted that significant wave heights did not exceed seven meters or 23 feet, which means that the peak wave height did not exceed 10 meters or 33 feet, which is well below the expected 100 year extreme sea state.
Figure 2: NOAA NDBC swell height (significant wave height) for the time period of interest
Design standards and hurricanes
Now that we understand Sandy’s actual at-sea characteristics, let’s take a closer look at how she would have affected the technology that makes up the bulk of an offshore wind system, namely the turbine and the foundation or substructure. In order to do this, we walk through the current design requirements for offshore wind turbines that help ensure that turbine will survive even the most severe storms. It should be noted that an in-depth discussion of current and future design standards for offshore winds is the topic of the next in the Extreme Weather Impacts on Offshore Wind series.
In theory, the worst case storm for a northeast (south of Cape Cod) or mid-Atlantic hurricane is much more severe than the statistics for Hurricane Sandy described in the discussion above. The worst case storm would be closer to a Category 3 hurricane, if one considers the likely design requirement of a storm that comes around every 100 years (100-year return period). So, how would the conditions brought by Sandy compare to the maximum design criteria of modern offshore wind turbines, and is the design criteria capable of weathering storms of this magnitude or greater?
The simple answer is that current offshore wind turbine designs would, in fact, be able to handle the hurricane extremes expected in the most northern latitudes, but it is strongly recommended that a detailed assessment of hurricane probability and severity be conducted for each project site. Further south, new design criteria will probably have to be developed for turbines placed in high threat zones with high annual variability of tropical storms. Where these boundaries should be drawn and the additional design conditions required to maintain safe and reliable offshore wind installations are two of the challenges facing the U.S. offshore wind industry.
Current practices used on the nearly 1,500 offshore turbines installed in Europe adhere to proven International Electrotechnical Commission (IEC) design standards that were developed and tested for land-based turbines globally. These standards do not specifically consider hurricanes as an extreme condition, but before we write off the current fleet of turbines, we need to put things into perspective. If there is one thing wind turbines are designed to handle, it’s high wind. Although uncommon, even on land, rare extreme winds can actually approach typhoon conditions. For example, an IEC Class IA turbine is the most stringent wind class defined by IEC 61400-01 and boasts resistance to sustained winds of 112 mph and peak 3-sec gusts defined at 156 mph. A gust of this magnitude is somewhere near an average Category 3 hurricane gust, according to the Saffir-Simpson Hurricane Scale that defines the Category 3 peak 3-second gust between 141 mph and 165 mph. Most offshore wind turbines are IEC Class IA, and therefore, most offshore wind turbines are already designed to survive Category 3 extreme gust conditions, which clearly exceed the conditions imposed by Sandy, which saw a maximum 5-second gust of 116 mph, according to the two data presented above.
But what about the Category 4 and 5 storms that are known to occur in the southern latitudes, and which may be more common in the future in the north as well? The second posting in this series will begin to answer this question.
US Offshore Wind Collaborative: Extreme Weather and Offshore Wind Turbines #1
– November 27, 2012Posted in: Energy News
To view the entire article by Chris Hart and Walt Musial, please click here!